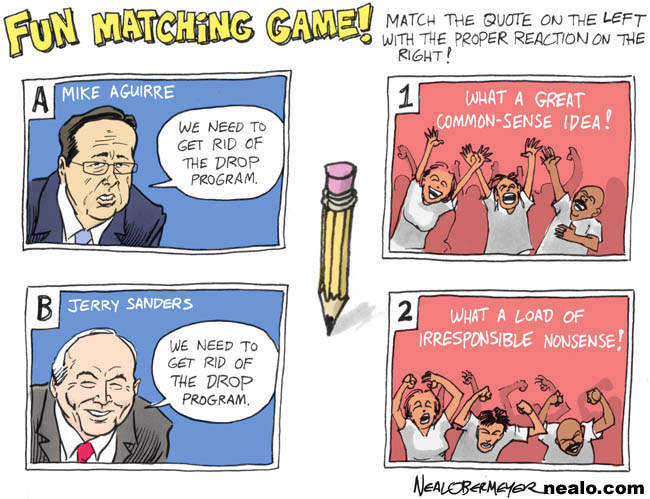
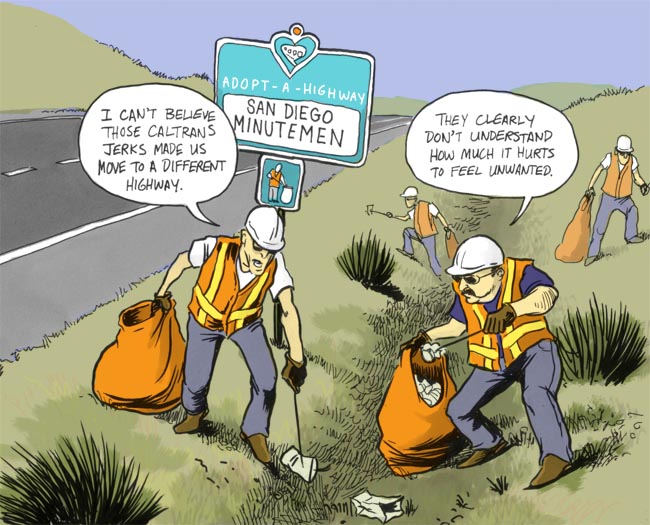
from the San Diego Reader
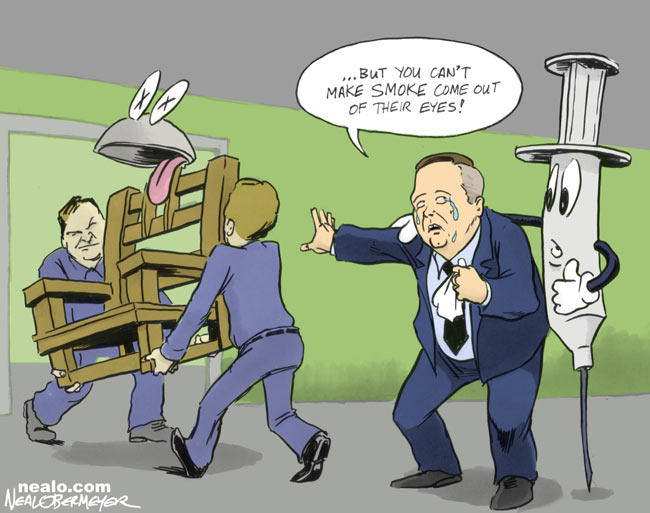
from the San Diego Reader
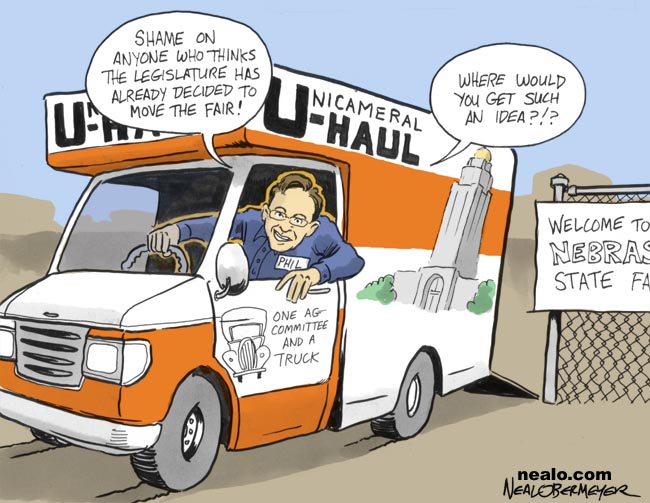
from the Omaha Reader
Although as a human being, I was excited to hear that the electric chair was deemed unconstitutional, but as a cartoonist, I was a little saddened because I never got to use the Zappy the Chair character. He made a few appearances in sketches, but never approved ones. Here was the most recent one:
Continue reading
Pam Platt of the Louisville, Kentucky Courier-Journal wrote a column this weekend about editorial cartoonists’ approaches to drawing minority candidates.
If you’re an editorial cartoonist, are there any special guidelines or sensitivities when it comes to drawing Clinton and Obama? How do you use exaggeration and caricature with these candidates, who are shattering gender and race ceilings, without falling in to sexist or racist traps?
Platt noted that the Courier-Journal pulled a Pat Oliphant cartoon the editors deemed “racially insensitive to Obama.” Platt felt the same cartoon depicted Clinton as “mannish-looking and big-bottomed.”
So Platt contacted ten nationally-syndicated cartoonists, with specific attention toward gathering a diverse bunch – or as diverse a bunch of editorial cartoonists as possible, and asked them a series of questions. Here are a few of the responses:
Lisa Benson, a California-based syndicated cartoonist: “For me, it’s not the race or gender as much as the candidate’s history and policies (baggage) that influence how I will draw that person. And, yes, Hillary comes with a good amount of baggage, mostly around the thighs.”
Nick Anderson: “A little girl once asked me why I made George Bush look like a monkey. I said, ‘I didn’t make him look like a monkey, God made him look like a monkey.’ I can say that, with tongue in cheek, and I can draw him that way, because we don’t have a pernicious, racist history of depicting rich, powerful white guys as monkeys. If we did, well, I’d have to reconsider.”
Read the rest here in column form, and here in full Q&A form with more info about each cartoonist.
Elsewhere in Kentucky, State Rep. Jim Gooch is trying to get revenge on some cartoonists and editorial writers.
According to Editor & Publisher, Gooch is pushing legislation that would categorize editorial writers and cartoonists as lobbyists, which would prohibit them from entering the House and Senate while lawmakers are in session. It’s all apparently retaliation for some cartoons mocking him last year.
from happyyoungpeople.com
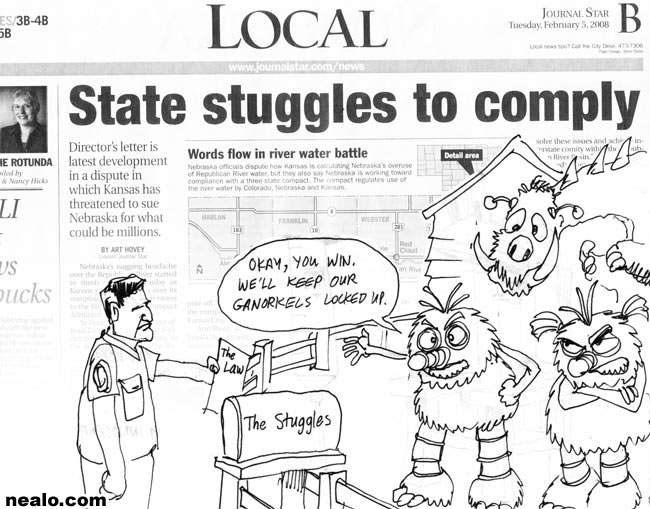
from the Lincoln Journal Star
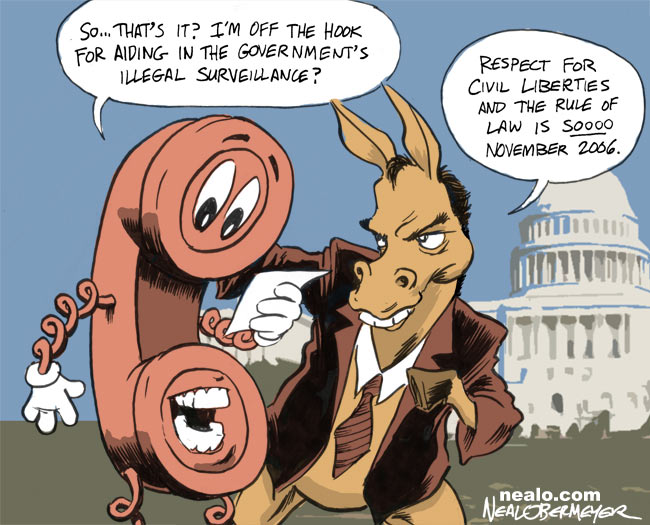
from the San Diego Reader
1. The media called California for Clinton after about 15% of the vote was counted. She had a percentage in the mid-50s while Obama was high-20s / low-30s.
2. As the percentage of total vote climbed from around 25% to 30%, I watched as Obama went from being down 54% to 32% to being down 53% to 37%. Most of this six-point gain happened within five percent of the total vote being counted.
3. I then watched the votes come in from 31% of the total vote to 51% of the total vote.
31% reporting | Clinton: 870,310 (53%) | Obama: 602,147 (37%)
32% reporting | Clinton: 912,326 (+42,016) (53%) | Obama: 626,344 (+24,147) (37%)
33% reporting | Clinton: 922,380 (+10,054) (53%) | Obama: 635,890 (+9,546) (37%)
34% reporting | Clinton: 962,217 (+39,837) (53%) | Obama: 664,023 (+28,133) (37%)
35% reporting | Clinton: 966,939 (+4,722) (53%) | Obama: 668,502 (+4,479) (37%)
38% reporting | Clinton: 1,001,136 (+34,197) (53%) | Obama: 697,311 (+28,809) (37%)
39% reporting | Clinton: 1,010,155 (+9,019) (53%) | Obama: 706,854 (+9,543)
41% reporting | Clinton: 1,060,326 (+50,171) (54%) | Obama: 741,983 (+35,129) (37%)
42% reporting | Clinton: 1,085,438 (+25,112) (53%) | Obama: 768,274 (+26,291) (38%)
43% reporting | Clinton: 1,109,151 (+23,713) (53%) | Obama: 788,257 (+19,983) (38%)
44% reporting | Clinton: 1,111,190 (+2,039) (53%) | Obama: 790,333 (+2,076) (38%)
45% reporting | Clinton: 1,124,957 (+13,767) (53%) | Obama: 804,489 (+14,156) (38%)
46% reporting | Clinton: 1,154,701 (+29,744) (53%) | Obama: 839,686 (+35,157) (39%)
47% reporting | Clinton: 1,159,529 (+4,828) (53%) | Obama: 846,023 (+6,337) (39%)
48% reporting | Clinton: 1,206,138 (+46,609) (53%) | Obama: 880,099 (+34,076) (39%)
49% reporting | Clinton: 1,211,869 (+5,731) (53%) | Obama: 886,319 (+6,220) (39%)
50% reporting | Clinton: 1,224,077 (+12,208) (53%) | Obama: 899,623 (+13,304) (39%)
51% reporting | Clinton: 1,239,311 (+15,234) (53%) | Obama: 911,622 (+11,999) (39%)
The difference in percentage closed, but not nearly as profoundly. Clinton’s lead at 51% was 53% to 39%.
4. This matches up closely with the gender-based exit polling, which showed Clinton with 52.8% and Obama with 40.8%.
I was pretty shocked by how Obama had pulled ahead in California polls, yet by midnight he was down by almost 20% in the actual vote count. Pundits are claiming it’s all the Hispanics and Asians going for Clinton; apparently everyone* forgot to talk to them over the past few weeks while conducting their polls.
So anyway, I decided to take a look at how the most recent polls compared to the vote count (as of 12:15am – 12:30am on Wednesday morning). I compiled current vote totals compared with RCP poll averages for states with RCP polls or at least a major poll conducted recently. Vote totals are from CNN.com and poll figures are from RealClearPolitics.com.
Significant differences, particularly reversals, are bolded.
Alabama RCP: Clinton 46, Obama 45
Alabama vote: Obama 56, Clinton 42Arizona RCP: Clinton 42, Obama 36
Arizona vote: Clinton 51, Obama 41California RCP: Obama 44, Clinton 43
California vote: Clinton 54, Obama 33Colorado Denver Post poll: Obama 34, Clinton 32, Edwards 17
Colorado vote: Obama 67, Clinton 32Connecticut RCP: Clinton 42, Obama 38
Connecticut vote: Obama 51, Clinton 47Georgia RCP: Obama 50, Clinton 32
Georgia vote: Obama 66, Clinton 32Illinois RCP: Obama 58, Clinton 25
Illinois vote: Obama 65, Clinton 33Mass RCP: Clinton 48, Obama 41
Mass vote: Clinton 56, Obama 41Minnesota public radio poll from January: Clinton 40, Obama 33, Edwards 12
Minnesota vote: Obama 67, Clinton 32Missouri RCP: Clinton 48, Obama 42
Missouri vote: Obama 49, Clinton 48New Jersey RCP: Clinton 48, Obama 41
New Jersey vote: Clinton 54, Obama 44New York RCP: Clinton 54, Obama 36
New York vote: Clinton 57, Obama 40Oklahoma Survey USA: Clinton 54, Obama 27
Oklahoma vote: Clinton 55, Obama 31Tennessee RCP: Clinton 47, Obama 34
Tennessee vote: Clinton 54, Obama 41
Three of the four reversals went to Obama; the fourth went to Clinton (obviously). And that one exception was the super-important California.
*The lone notable exception being SurveyUSA, who had her up by 10 points, though that was more than negated by Reuters/CSPAN/Zogby, which had Obama up by 13.